Algebra Performance by Different Factors


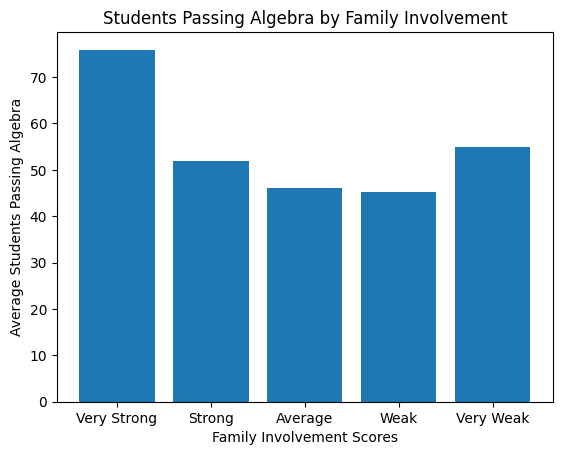
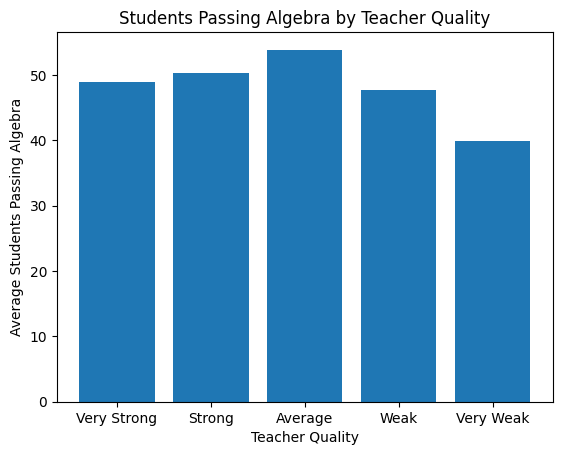
For these visualizations from the 2011 data, we used the variable 'Students Passing Algebra' as an indicator of total academic performance. One insight from these graphs is that family involvement seems to have a significant effect on the number of students passing algebra. For those with 'Very Strong' levels of family involvement, there is about a 20 point increase from those with 'Strong' levels. This mainly holds for the 'Very Strong' as the other four levels have similar amounts of students performance. A second insight that we drew from these is that the teacher's quality, which was indicated by a teacher score, had a great effect on a student's performance up to the 'Average' level but decreased past that. Our third insight was that family involvement is a greater factor in the chance of a student passing algebra than the quality of the teacher. This was a surprising thing to find but can be seen in the visualizations. For example, 'Very Strong' levels of family involvement led to an average of about 75% of students passing algebra whereas a 'Very Strong' quality teacher saw about 48% of students passing the class on average.
Overall Performance based on Safety Score and Attendance

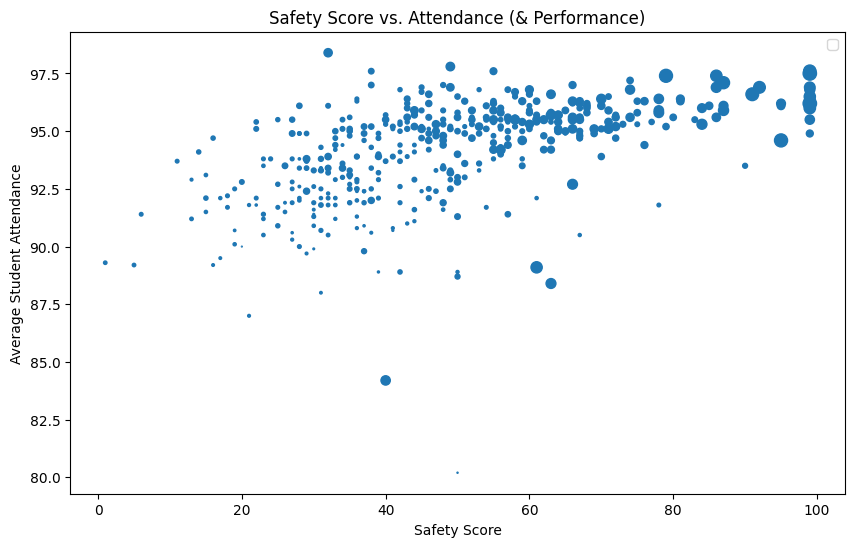
For this visualization, we utilized the 2011 data and sought to see how the safety score of a school and student attendance rates affected performance. Our first insight was that a higher safety score tends to result in a more highly attended school. As we move across the x-axis, the y-values increase, suggesting a positive relationship between safety and attendance. This relationship decreases in strength towards higher safety scores as schools with safety scores around 60 have similar attendance to schools with a score of 200. This might indicate that safety scores increase attendance up to a point. Another insight that we had was that higher safety scores led to better performance. The performance level is indicated by the size of the point, and as the safety score increases, the size of the points increases as well. A third insight that we have is that student attendance doesn't seem to be the best indicator of performance. For example in the 95.0-97.5 range for attendance, there are a wide range of performance levels from very low to the highest of the data. Since there is such a big gap in performance between schools with similar attendance levels, attendance does not seem to have a great effect on overall performance.
Performance and Attendance by Health School Certification

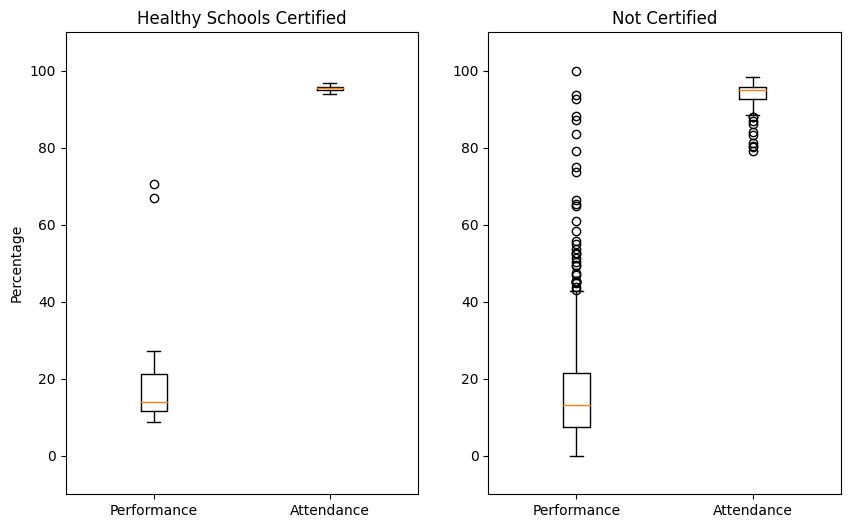
With this information from the 2011 data set, we sought to figure out whether having a healthy school certification affected both performance and attendance. One initial insight of ours is that the healthy schools have similar levels of attendance to the uncertified schools. The uncertified schools have a wider range of values but a similar mean. Another insight that we had was that certified schools had a higher minimum performance than uncertified schools, but uncertified schools had a higher maximum and third quartile; however, in total, the main boxs for each are quite similar. This likely indicates that the certification status of the school has little effect on the outcomes. A third insight that we noticed was that there were many more outliers in the uncertified group, which indicates a wider range of outcomes. This might also be due to the fact that a majority of Chicago public schools are not certified.